Key Words: Technical Indicators, Trading system.
The Indicators Panel option is enabled only when a Chart is open for viewing. Technical indicators are primarily used to analyse price movement in a security. All indicators aim to provide an indication of the current direction and momentum of a security in relation to past price action. The period over which an indicator compares price action can be varied to match the market or to match the requirements of a trading system.
Each indicator has advantages and disadvantages that must be considered. By combining several indicators the weaknesses of one may be compensated for by the strengths of the others.
A single technical indicator or a collection of indicators does not constitute a trading system. Only when exact criteria for entering and exiting a trade are defined using the indicators does a trading system exist. The trading system is then combined with risk management and money management to create a trading methodology.
Beyond Charts provides most of the popular technical indicators. The list will be expanded over time as the need arises. The Indicators are divided into 14 Groups and Fig.3.12 shows the list of Indicators implemented in Beyond Charts:
|
Group |
Items |
|
Bands |
Bollinger Bands |
|
Fractal Chaos Bands |
|
|
High Low Bands |
|
|
Moving Average Envelopes (xMA) |
|
|
Prime Number Bands |
|
|
Index |
Trade Volume Index |
|
Momentum |
Aroon Oscillator |
|
Chaikin Money Flow |
|
|
Chande Momentum Oscillator |
|
|
Fractal Chaos Oscillator |
|
|
MACD |
|
|
MACD Histogram |
|
|
Momentum Oscillator |
|
|
Prime Number Oscillator |
|
|
Rate of Change |
|
|
Stochastic Oscillator (Full) |
|
|
TRIX |
|
|
Ultimate Oscillator |
|
|
Williams %R |
|
|
OB/OS |
William Accumulation Distribution |
|
OBV |
Price Volume Trend |
|
Other |
Swing Chart |
|
Swing Index |
|
|
Smoothing |
Chande VIDYA |
|
De-trended Price Oscillator |
|
|
Exponential Moving Average |
|
|
Median Price |
|
|
Price Oscillator |
|
|
Simple Moving Average |
|
|
Time Series Moving Average |
|
|
Triangular Moving Average |
|
|
Typical Price |
|
|
Variable Moving Average |
|
|
Weighted Moving Average |
|
|
Welles Wilder Smoothing |
|
|
Strength |
Accumulative Swing Index |
|
Average Directional Index |
|
|
Mass Index |
|
|
Performance Index |
|
|
Relative Strength Comparison |
|
|
Relative Strength Index |
|
|
TBD |
Linear Regression Forecast |
|
Linear Regression Intercept |
|
|
Linear Regression R-Squared |
|
|
Linear Regression Slope |
|
|
Trading Bands |
Parabolic SAR |
|
Percentage Trailing Stop |
|
|
Vol Strength |
Ease of Movement |
|
Volatility |
Average True Range (xMA) |
|
Average True Range Volatility |
|
|
Chaikin Volatility |
|
|
High Minus Low |
|
|
Standard Deviation |
|
|
True Range |
|
|
Vertical Horizontal Filter |
|
|
Volatility Stop |
|
|
Volume |
Money Flow |
|
Negative Volume Index |
|
|
On Balance Volume |
|
|
Positive Volume Index |
|
|
Volume |
|
|
Volume Oscillator |
|
|
Volume Rate of Change |
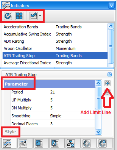
The Indicators list can be sorted from A-Z or Grouped using the menu button. When you click on an Indicator, the associated parameters and visual settings will appear in a section at the bottom of the panel. This allows the user to alter the Indicator before applying it. Fig.3.13 highlights the option.
If the indicator is set on Group Mode and if the list is not expanded, double clicking on the Group Name with the gray background in the Indicator Panel will expand the whole list. The other method to show the Group Menu is to click on the A-Z Menu and then change it back again to Group Menu.
© Copyright Quantum Methodologies, 2014.
ALL RIGHTS RESERVED
Send Feedback on this topic to Beyond Charts.