Fig.3.24
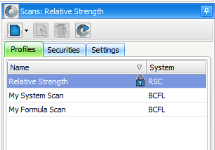
This displays all the Scan Profiles. There are three tabs available in the Scan Panel: Profiles, Securities and Settings. The Securities and Settings tab are associated with the Profiles tab. The Start Scan menu button at the top right corner in the Scans panel will only be enabled when the profile selected actually has all the necessary fields filled. An explanation of the functionality for each tab is provided below:
To set a new scan profile, click on New at the top of the Scans panel, select the System for the new scan profile, give it a name (Example: My Scan) and select OK. Once a profile has been created, it will be displayed in the Scan Profile column. Notice that there are 2 columns shown in the Profiles tab, Name and System. The System column will reflect the selection chosen when creating the new profile.
Only these types of “System” are currently supported:
System:
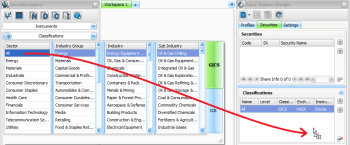
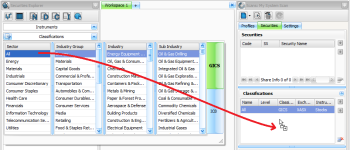
The Securities Tab displays three sections labelled Securities, Classification and Watch Lists. If the desired stock grouping, sectors or classifications do not already appear in at least one of the three windows, then open the Securities Explorer slide out panel and select which Sector Classification(s) you wish to scan with your Custom Profile). Simply ‘drag & drop’ your selections anywhere over the Scan slide-out panel. It will automatically locate to the correct window as shown in Fig.3.25 .
The Classifications window will then display the selection with column headers: Name, Level, Classification, Exchange and Instruments. The Exchange and Instruments can be modified to the following options listed:
|
Exchange:
|
Instruments:
|
The Relative Strength Comparison (RSC) Scan in Beyond Charts allows a user to scan securities to list those outperforming a specific Market, Sector or other securities of the user’s choosing.
In order to run an RSC scan, the user must first setup a new RSC Scan profile, and then specify the items they wish to scan, along with the RSC Parameters (settings) they wish to use for the scan.
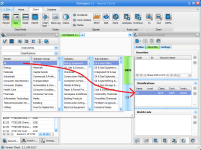
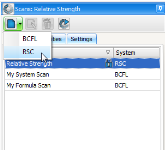
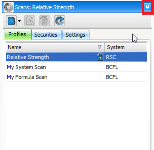
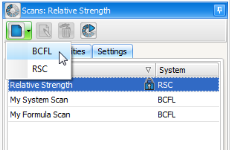
To setup a new RSC Scan profile, click NEW, RSC in the Scans panel as shown in Fig.3.26 .
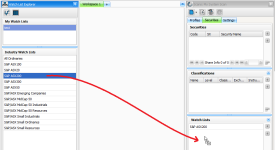
After giving the RSC Scan profile a name, click OK and it will appear in the Profiles list. Secondly, to add the items to the scan that the user wishes to scan, ensure that the Scan profile is highlighted and click the Securities tab. For a newly created scan, the 3 boxes will be empty and at least one needs to be filled for the scan to run. Drag and drop either a Watch List from the Watch List Explorer on the left hand side panel or individual Securities or Classifications from the Securities Explorer as shown in Fig.3.27 .
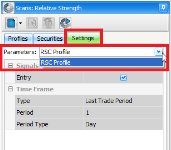
Once the scan has items defined, it also needs a Parameter profile (settings) associated with it. If there is already an RSC Parameter profile setup, it just needs to be selected from the Parameters drop down menu in the Settings tab as shown in Fig.3.28 .
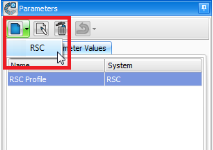
To create a new RSC Parameter profile click the New, RSC option in the Parameters panel as shown in Fig.3.29
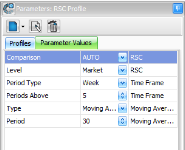
After naming the Parameter profile, the settings can be reviewed and modified, if needed, in the Parameter Values tab, shown in Fig.3.30 where user preferred Moving Average types and periods can be set, along with an individual security or AUTO comparison (either Market or Sector) as well as scan time frame, which can be set for x days, weeks or months.
Once setup, the newly created RSC Parameter profile can be associated with the RSC Scan profile as described above.
As with other scans (BCFL), users can start scanning via the Scans panel Start Scan button or select their desired scan from the Systems menu in the Beyond Charts ribbon.
The first step to running a ‘BCFL scan’ is to set up your formula or system in the [Scan Profile] panel which is located in the right hand menu. Once the ‘Scan Profile’ panel is opened, pin the panel for use.
In order to run an BCFL scan, the user must first setup a new BCFL Scan profile, and then specify the items they wish to scan, along with specifying the Formula/System and settings they wish to use for the scan.
Quick Reference allows you to quickly view tips and instructions on how to use BCFL functions. It gives you the definition of the function, its syntax, an example, its parameters and useful links for further reading.
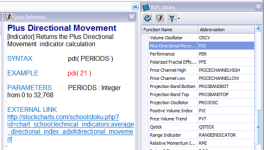
The Quick Reference button is found on the panel menu of the BCFL Library Panel. Upon clicking the button, the Quick Reference will open as a window within the current workspace.
New Scan
To setup a new BCFL Scan profile, click NEW, BCFL in the Scans panel as shown in Fig.3.26 .
Profiles
After giving the BCFL Scan profile a name, click OK and it will appear in the Profiles list.
Securities
Secondly, to add the items to the scan that the user wishes to scan, ensure that the Scan profile is highlighted and click the Securities tab. For a newly created scan, the 3 boxes will be empty and at least one needs to be filled for the scan to run.
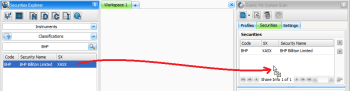
You can add individual securities by searching for the security name in the ‘Securities Explorer’, in this case BHP and once highlighted, left click and drop ‘n’ drag the security into the Scan Profile panel. You can add as many securities as you wish.
You may wish to add one or more watch lists to your ‘scan’. Highlight the watch list in the [Watch List Explorer] and then drop n drag it into the ‘Scan Profile’ panel.
Alternatively, you may prefer to scan securities in an industry group or sector or even scan the entire market. You have the ability to enter categories of securities from the ‘Classifications’ tab located in the ‘Securities Explorer’ and you can add them to the ‘Scan Profile’ panel by dropping n dragging.
Once you have dropped n dragged items into the Scan Profile panel, you will visually be able to see the break up of Securities, Classifications and Watch Lists you have added to your ‘Scan Profile’.
Settings
The ‘Settings’ tab allows you to define your scan settings.
Click the down arrow beside ‘Formula’ and you now have access to your saved BCFL Formulas and Systems within the Formula Explorer.
Select a BCFL Formula or System from the drop down list to add it to the ‘Scan Profile’.
BCFL Formula
If a BCFL Formula is selected, the only remaining component to complete your ‘Scan Profile’ is the ‘Time Frame’.
BCFL system
If a BCFL System is selected, an area called ‘Signals’ defines how the system will run. Although the Long Entry, Long Exit, Short Entry and Short Exit are selected within the Signals, the scan will ONLY run across the formulas you have defined as part of your system. Eg; if you have previously created a Long Entry and Long Exit Formula, the Scan will ONLY run the Long Entry and Long Exit even though the Short Entry and Short Exit tick boxes are ticked.
However, if you have created a Long Entry and Long Exit system but only wish to run a scan for Long Entries, you can un-tick the Long Exit.
Time Frame
Lastly, set the Time Frame for the Scan from the Settings tab. The typical settings should be Type = Last Trade Period, Period = 1 (or a few), Period Type = Day (unless weekly data needs to be scanned).
Avoid using Type = All available data for BCFL Scans when scanning as you typically need to know whether an alert has occurred over the recent past. For further historical testing, use Back Test from within the BCFL Formula Editor.
Click [Start Scan] and the Scan Results window will pop open. Each security that meets the Formula’s conditions will be listed in the Scan Results window. These results can be saved to a Watch List or even exported to Excel.
Once the scan is complete, double click on any of the listed securities and a chart window will pop open. Use an Overlay containing the saved indicators used in the script to overlay the script indictors on the chart.
As with other scans (RSC), users can start scanning via the Scans panel Start Scan button or select their desired scan from the Systems menu in the Beyond Charts ribbon.
© Copyright Quantum Methodologies, 2014.
ALL RIGHTS RESERVED
Send Feedback on this topic to Beyond Charts.