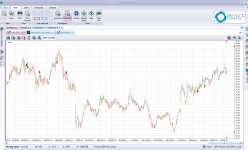
A Chart Window displays the price history and any applied indicators or line studies for a selected Security.
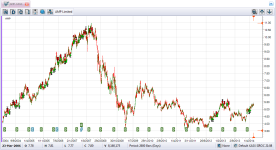
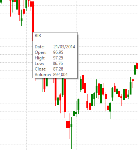
The OHLCV data is displayed on the status bar of the Chart as shown on . Users are required to hover the mouse over the chart and point the cursor to the required bar to display the OHLCV data for that selected date.
From an open chart window, the user can use the Pg Dn and Pg Up keyboard keys to move down and up a chart at a time. If a single chart is opened from the Securities Explorer, the next displayed chart will be the next in the Beyond Charts database. However, if the opened chart is in a Watch List, only charts within that Watch List will be displayed in the order in which the Watch List was saved.
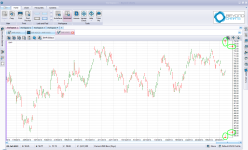
Instead of the Pg Up and Pg Dn keys on the keyboard the Up and Down arrows at the top right corner of the chart window, as can be seen in Fig 4.1, can also be used to step up and down through a Watch List or any chart list.
The status bar at the bottom of the chart will also display if any Overlay is applied to the chart at the time. As shown in to the right of the OHLCV figures, the overlay notification depicted by the yellow and grey square icon shows what Overlay group and key are applied to the chart.
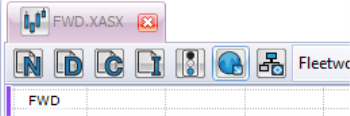
Multiple charts and/or Watch Lists can be opened from the Securities Explorer and Watch List Explorer, with parent objects, (charts and data sheets) being tabbed to avoid the workspace being compressed with charts and data sheets being opened side by side.
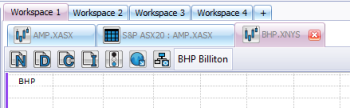
Fig.4.1
Child objects, such as Dividends, Share Information, Notes and Signals are opened to the right of Parent windows, and can be moved and re-positioned as covered in section 1.2.2 - General Terms > Windows > Window Size and Position.
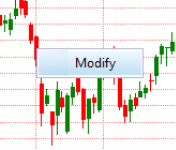
Fig.4.2
The Precision or decimal places of the chart can be modified to the users need, by simply rightl clicking on the chart and selecting MODIFY. Users can then set their desired number of decimal places for the charts, and therefore lines studies to inherit.
Some line studies display information outside the default scaling of the chart. The best example is the Fibonacci Projection lines that can place forecast levels above the current price outside the default scale.
Using the red scaling handles on the right at the top and bottom of the chart, allows the user to adjust the price scaling allowing prices above or below the default scaling to be shown.
The scroll bar at the bottom of the chart window allows the user to browse throught the history of the chart easily.
Users can also scroll the chart using the arrow keys on their keyboard. Using the left and right arrows will scroll the chart forwards or backwards 1 bar at a time, holding shift whilst using the left and right arrows will scroll the charts forwards or backwards 1 week (5 bars) at a time.
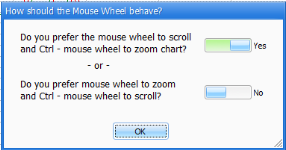
Chart scrolling is also achieved by using their mouse wheel. When you first use your mouse wheel, users will be asked for their preference with using the mouse wheel to scroll or while also holding down control (CTRL) on your keyboard (the alternative choice will change chart zoom). Using this method, the chart scrolls by 2 weeks (10 bars) or a single bar when also holding down shift.
There is another more precise method to view the price details and that is by right clicking on the chart and selecting the Value Line as shown on Fig.4.4 . To continue checking the next or previous price details, the keyboard left and right arrow key will move the Value Line to the left or right one bar at a time. Holding shift and using the left and right keyboard keys will move it 1 week (or 5 bars) at a time. The mouse can also be used to drag the Value Line to any desired data on a chart.
The Value Line also displays values of indicators that have been inserted as separate graphs below the price graph.
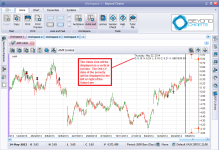
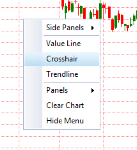
Fig.4.5
The Crosshair is also accessible from the right click menu within a chart window. It does not display the OHLCV data that the Value Line does; it displays both a vertical and horizontal line with date and close value of the price or indicator series. Shown below in Fig.4.6 is a crosshair on a price chart of BHP.XASX. As with the Value Line, the Crosshair can be moved by either the left or right keyboard keys or dragging by the mouse.
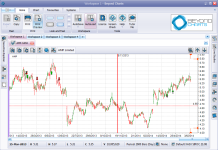
A unique feature of the Crosshair within Beyond Charts is the horizontal line per series. This enables the user to not only see the value of the close price of the price chart at any point in time, it will display the value of any indicators on that date that are applied as well.
In Fig.4.7 below, BHP has both a Volatility Stop and an ATRVE applied to the chart. The Crosshair that has been applied is displaying values for all series: BHP’s close price, Volatility Stop upper and lower limits, as well as the ATRVE value as at the 21/11/2018.
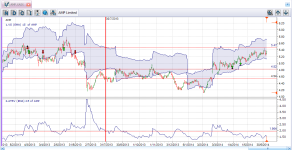

Fig.4.8
Another commonly used Line Study that is available on the right click menu of an open chart window, is the Trend Line. This has been discussed, in section 3.4 -Panels > Line Studies, where a Trend Line can also be applied from, but as it is often used, it is readily available on the right click menu.
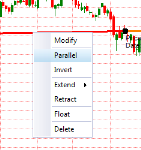
Fig.4.9
Once a Trend Line is applied to the chart, additional options upon right clicking on that Trend line are available: Line Study -> Modify or Delete, Parallel Tend Line -> Parallel or Inverted.
Line Study >Modify allows the user to modify the thickness, colour, transparency, position, extensions and extension colour or delete the Line Study.
Line Study > Delete will remove just the highlighted Line Study.
Parallel Trend Line allows the use to either create an additional Parallel or Inverted trend line created from the already applied one.
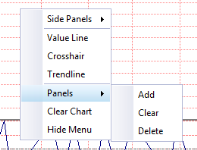
TheRemove Panel option shown in Fig.4.10 relates to indicators that have been applied to the chart. This option will only be enabled upon right clicking within a panel of an applied indicator. This gives the user the ability to remove individual panels of indicators, without having to fully clear the chart (explained below).
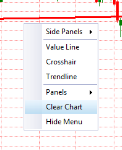
Fig.4.11
Clear Chart enables the user to remove all applied Line Studies or Indicators from the chart, leaving just the price series, along with any signals they have enabled on the chart.
Beyond Charts gives users the ability to display Corporate Actions, Dividend and Notes on the chart.
Using the Signals section in the Chart tab in the top ribbon of Beyond Charts, users can enable or disable the relevant signals they wish to display on the charts.
Tooltips (hints) will show when hovering the mouse over the signals, and double clicking on any of the ‘C’, ‘D’ or ‘N’ signals, will open the relevant child object to the right of the chart if not already open, and highlight the item that was selected.
Enabling the Notes signals in the Chart tab, will display a ‘N’ signal at the bottom of the chart, for every note that a user has created and selected to ‘Show’.
Further information on creating notes is shown below in Section 4.1.11 - Chart > Menu.
Each of the dividends that are listed in the Dividends object described below in 4.1.11 - Chart > Menu, can be displayed on the chart as a ‘D’ signal as shown in Fig.4.12 .
Corporate Actions, when enabled to display on the chart are shown with the signal ‘C’ can like the dividends, show all the items from within the Corporate Actions object.
4.1.9.4 Indicator Signals
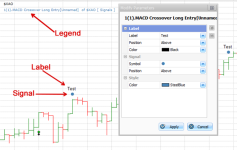
You may apply indicators, including BCFL Indicators, as signals on a chart by right clicking the Indicator once applied and selecting Signal.
The parameters of the Indicator Signals may be modified via right click > Modify.
The Modify Parameters window gives you a variety of options to customize the way you want signals to appear on your chart:
Label – allows you to attach text to each signal created by the indicator
Position – allows you to choose the position of the label (Above, Below)
Color – change the color of the label
Color - affects the color of the signal and the font color of the legend entry on the upper left of the chart.
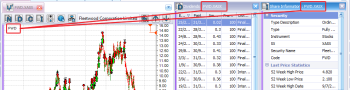
The Chart Window can act as the parent of all associated windows. Therefore, when a chart is opened, and then child objects are opened from that chart, the coloured ribbon will automatically match the colours of all other associated windows. See Fig.4.14 below, where all the vertical coloured ribbons are light blue, indicating a relationship between the windows.
The coloured ribbon is shown at the left side of the Chart Window to indicate the relationship between each window, Dividend, Share information, Notes, Corporate Action and Signal Summary. If another chart is opened using the Security Chooser or the security has been navigated to via Pg Up or Down, then the newly opened Security will be displayed and the other associated child windows will be automatically updated with the information applicable to the parent.
The colour of the relationship ribbons is random upon opening charts or data sheets.
If there is a chart open, along with a child object that was opened from a previous parent (i.e. they are not linked), a user is able to manually create a parent / child relationship by dragging and dropping the colour ribbon from either the parent to the child or the child to the parent.
The Security Chooser Window is invisible and will only be displayed when the user types in a Security Code on an opened Chart Window.
To change the Chart to a different security, merely start typing the Security Code or any part of the Security Name using the keyboard. The Security Chooser Window will automatically pop up and start searching for the text typed.
For example, if the currently charted stock is BHP and would like to display Fleetwood and do not know the stock code merely start typing ‘F’, ‘L’, ‘E’. The Security Chooser window will be displayed as shown in Fig.4.13 .
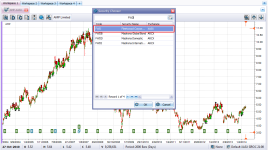
Once the desired security is shown in the list, double click the Security Name displayed or if a complete security code has been typed in correctly, pressing [Enter] will automatically replace the Chart of the previous security with the newly selected security.
Alternatively, the "Open Security Chooser" icon at the top right of the chart window can be clicked to pop the Security Chooser.
All the indicators or opened child windows such as Dividend; Share Information will be maintained and the codes on the title bar of each window will be update to match the newly opened Chart. Therefore, the parent-child relationship of each opened window will remain connected as shown on Fig.4.14 .
There are 5 Menus available at the top of the Chart Window:
• Watch List
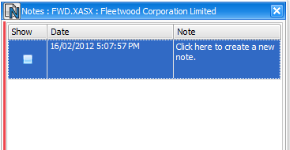
Fig.4.15
The Notes window allows users to add text notes by date related to a particular security. The notes will be saved automatically and will remain saved until the Note is deleted.
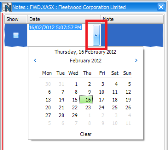
The current date will be displayed in the Date Column. The user can amend the Date by clicking on the drop down arrow on the right side of the date specified to view the calendar, as shown in Fig.4.16 .
To add a note, simply click in the empty column right below the Notes Column header and start typing a note. Once completed, click anywhere in the Notes window. A blank note with the current date will be created as a New Empty Note.
The Show option in the Note Window allows user to display the Notes on the Chart of the relevant security as “N” Signals.
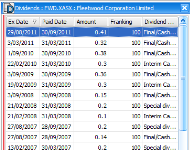
The Dividend Window will display the entire Dividend history for the selected Security. The table contains the following details: Ex Date, Paid Date, Amount, Franking and Dividend Type.
There will be 3 different types of Dividend:
|
|
The Interim and Final Dividends are usually updated for 6 months depending on the reporting date of the particular Security selected. A Special Dividend can be paid by a company separate from the typical recurring Interim and Final dividend cycle. Fig.4.17 shows an example of the Dividend Window in the Beyond Charts.
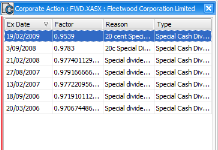
Fig.4.18
Any corporate actions relating to a security will be displayed in the Corporate Action. If any unusual price drop or split is visible on the chart, chances are that there may be some corporate action related to that price action.
There are 4 columns displayed in the Corporate Action table:
|
|
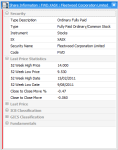
The Share Information window, Fig.4.19 displays a variety of technical and fundamental information for the selected Security. The data is divided into 6 groups:
The Fundamentals group currently includes the latest PE Ratio, EPS, DPS, Market Cap and NTA. This information can also be displayed, sorted and filtered in the Data Sheet functionality, using the column chooser discussed in section 4.2.1.3 below.
To view details of each group, click on the (+) symbol to expand the list.
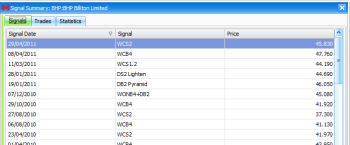
Fig.4.20
The signals object opened via the chart window, will display the individual signals, trades and statistics information for the signals visible on the chart. These could be either BCFL signals or any other signals that are programmed into Beyond Charts.
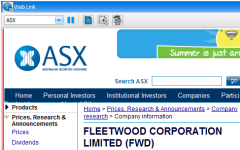
The Web Link object gives the user the ability to browse both default and user defined websites from with Beyond Charts. This is useful to quickly browse for announcements and the like on securities all from within the program and not an external browser. It currently comes with 5 default News Feeds pertaining to the ASX shown below.
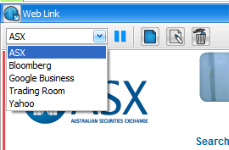
Users can change between the News Feeds by selecting the desired one from the drop down list, once chosen the Web Link browser will refresh to that chosen News Feed.
The Web Link browser also refreshes to display the relevant share code according to the focused chart, or line item within a datasheet. A Web Link browser that has been opened from a chart will update to the new security when the user changes by paging down (usually when looking through a watchlist) or changing the security via the securities chooser (typing directly on the chart).
A Web Link browser that has been opened from a datasheet of a number of securities, will update to the new security when the user selects a new line item within that datasheet.
Pressing Pause will stop this automatic refresh occuring until unpaused. This is useful if you wish to continue looking at one particular securities News, but want to view another's chart without the need of opening a fresh chart.
The New option, allows the user to create their own News Feeds. This is useful for those users trading different exchanges, or simply those that prefer a different news website over the defaults.
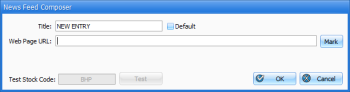
To create a new News Feed, simply give it a title (replace NEW ENTRY), select whether it should be the default or not and paste in an example of your chosen webpage that is looking at a security.
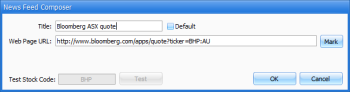
The News Feed Composer then requires the user to Mark the place in the web address when the physical security code resides. This gives it the ability to change the code dynamically, depending on what security the user is viewing. Simply highlight the code using the mouse and select Mark on the right of the address.
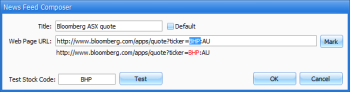
Users have the option to Test the created News Feed before saving it, by entering in a Test Stock Code and clicking Test. Once satisfied all is working as it should, clicking OK will save that News Feed into the list.
If any of the News Feeds need to be edited, selecting it from the list and clicking the Edit button at the top of the News on Stocks browser will bring up the News Feed Composer again, giving the user the ability to edit the name and / or the Web Page URL.
If any of the News Feeds need to be deleted, selecting it from the list and clicking Delete will remove that news feed permenantly from the News Feed list.
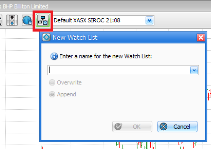
4.1.12.7 Watch List
The Watch List object allows you to add the currently open chart to your desired Watch List. You can either select an existing Watch List or define a new Watch List.
A list of all the applied indicators in a panel on the chart are viewable in the top left corner. If you are viewing many indicators as a part of your analysis or overlay or you have a smaller screen, you can compact the list by right click on any of the indicators and select ‘Compact Legend’ from the end of the list..
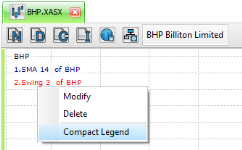
You can also use this list to modify the indicators, see section 4.1.9.4 for more details.
Y-Axis labels will show the last bar value for indicators and price action on your chart (price action displayed is the last closing price). This allows you to have a reference as you scroll through the historical data on a chart.
These labels can be hidden by right clicking any of the labels shown on the axis.
If a user hovers their mouse over the bar of a chart or an indicator series, the relevant data values for that series will appear after a few short seconds as a ‘tool tip’. This helps the user quickly identify relevant data for a particular trading day. Information provided in tool tips:
Tooltips do not display the values of Line Studies.
© Copyright Quantum Methodologies, 2014.
ALL RIGHTS RESERVED
Send Feedback on this topic to Beyond Charts.